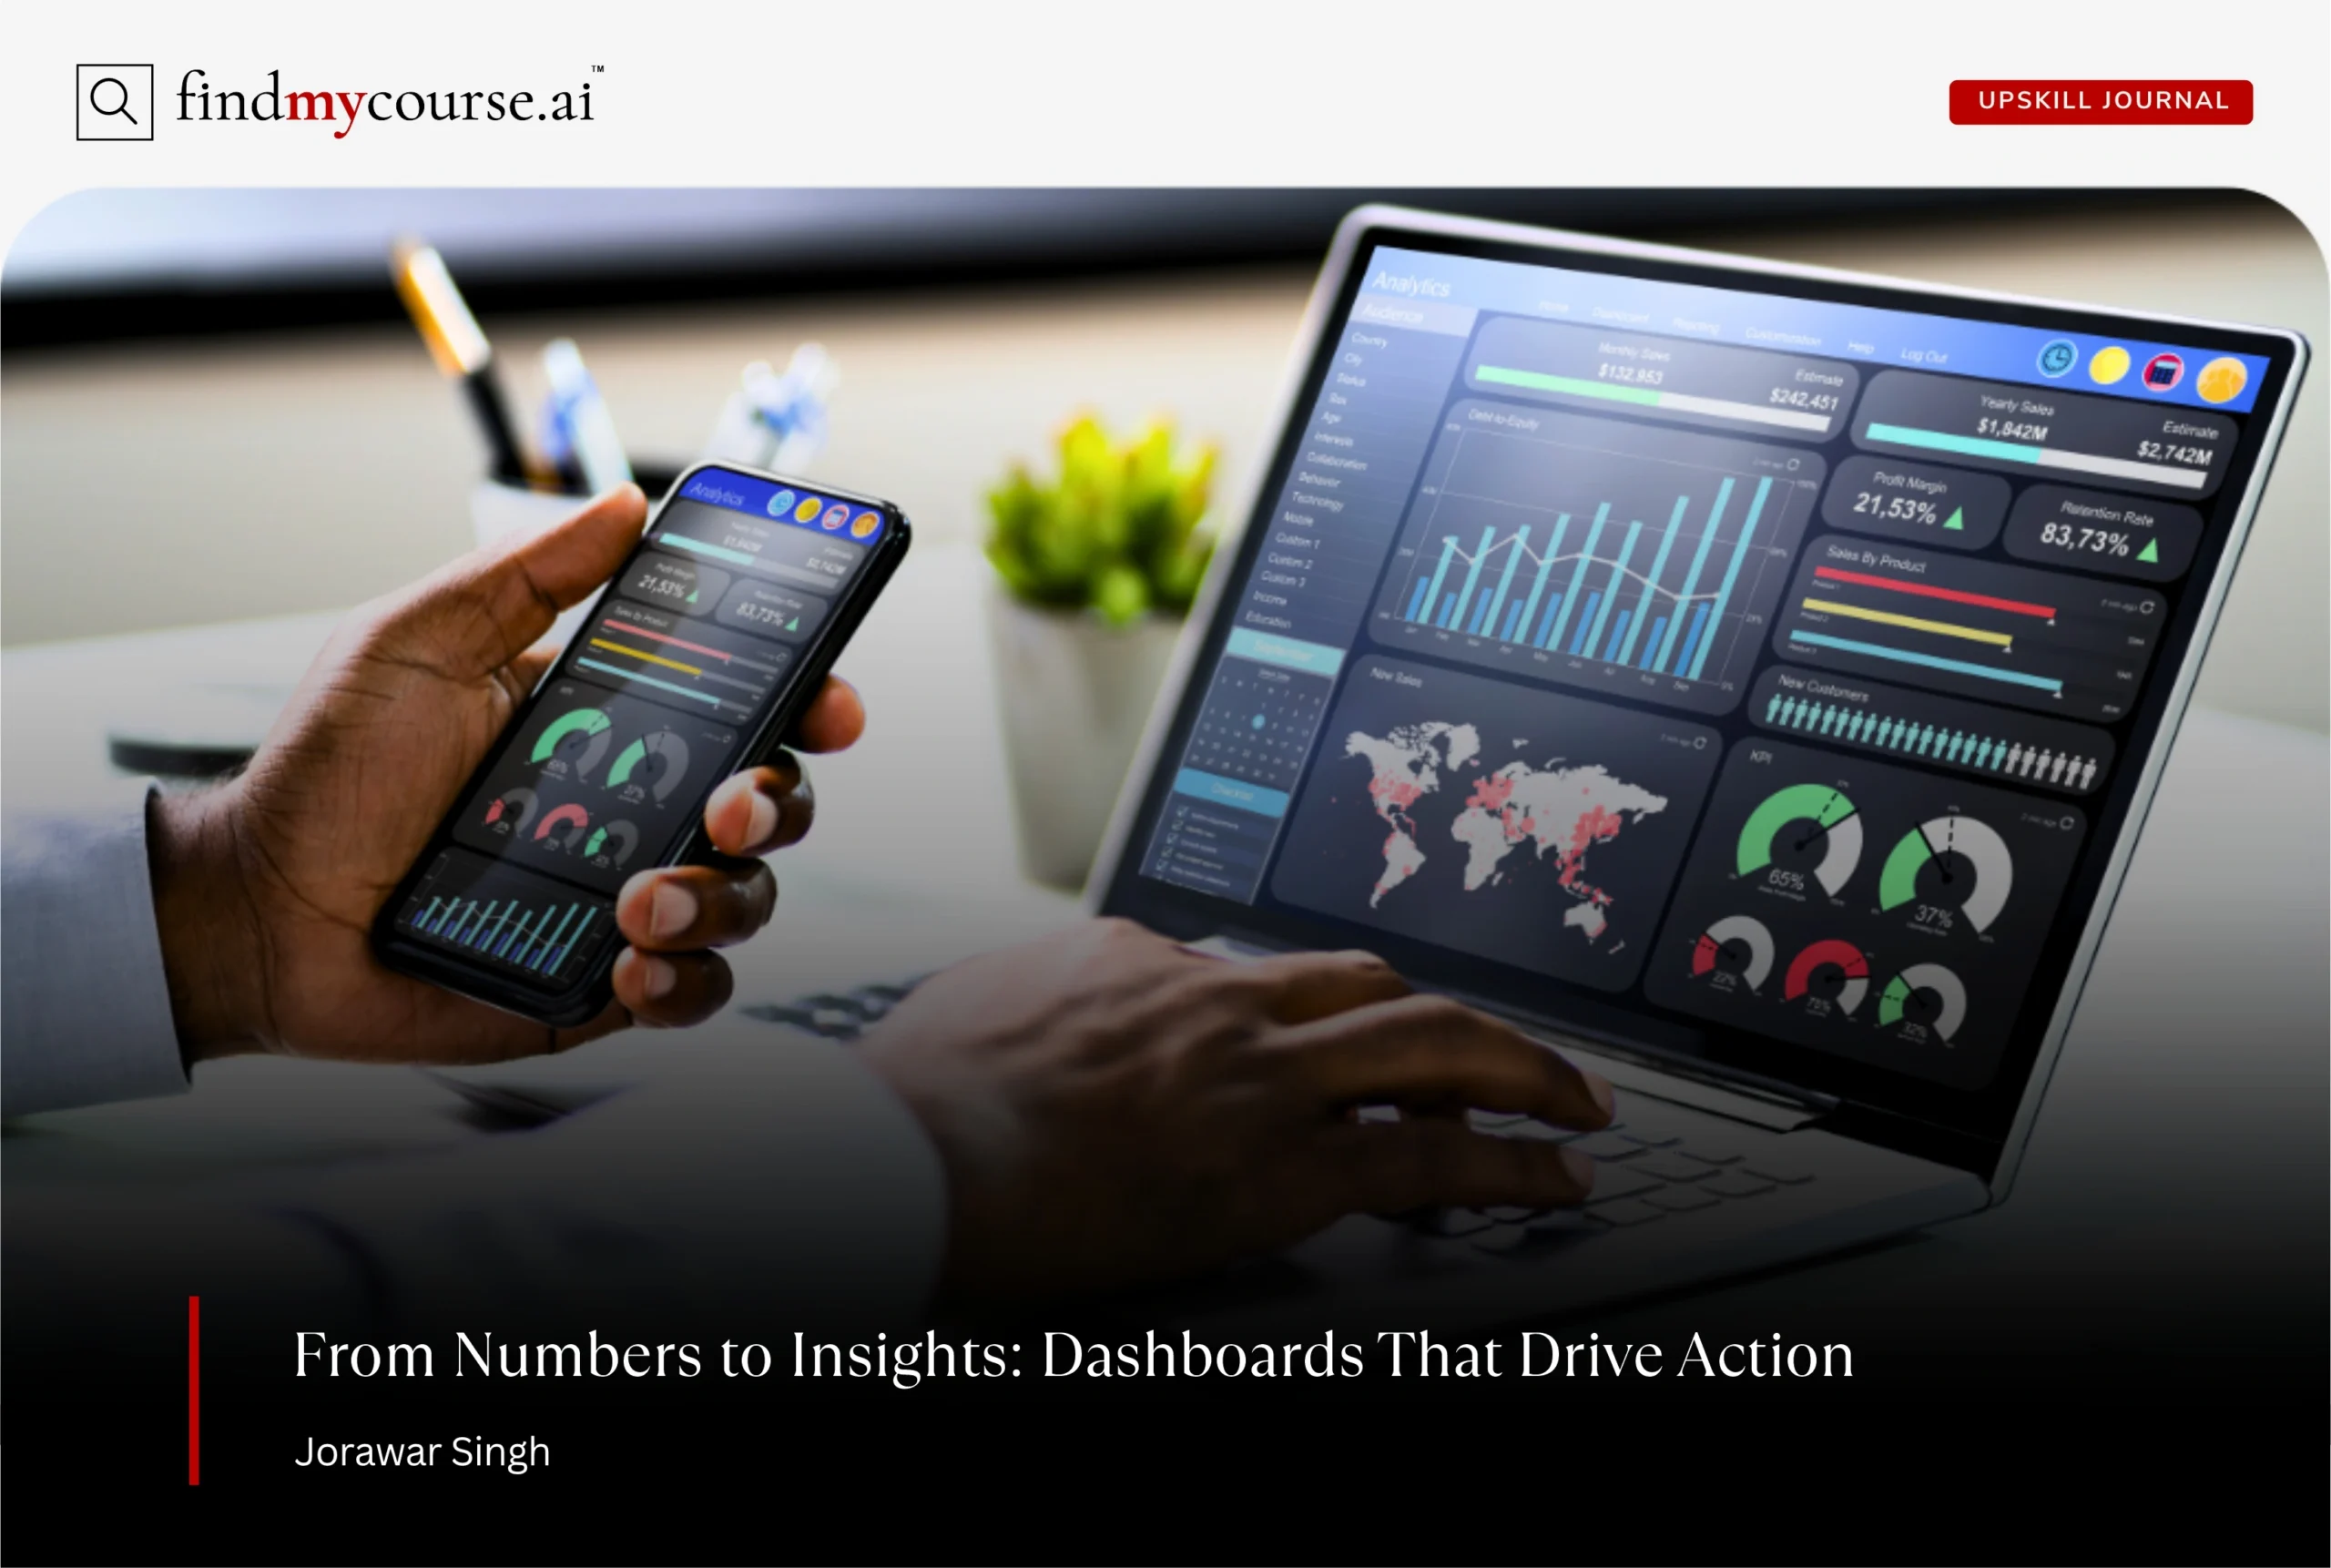
Creating a business analytics dashboard is about more than putting numbers on a screen. A good dashboard helps people quickly understand what’s happening and what to do next. When designed well, it turns complex data into simple insights that guide better decisions.
The problem is that many dashboards overwhelm users with too much detail or information that doesn’t connect to real actions. As a result, teams stop using them. The solution is to design dashboards with clarity, purpose, and the user in mind—and with so many opportunities to study online in areas like dashboard design, anyone can build dashboards that drive action. In this guide, we’ll explore practical steps to create dashboards that don’t just present data, but actually drive meaningful action.
What Is a Business Analytics Dashboard?
Analytics dashboard is a visual tool that consolidates essential business metrics and insights into a single, easy-to-read view. It transforms raw data from multiple sources—such as sales systems, marketing platforms, and financial tools—into clear visuals like charts, graphs, and key performance indicators (KPIs).
Instead of scrolling through lengthy reports or analyzing endless spreadsheets, a dashboard allows users to see what’s happening in real time, understand how performance aligns with goals, and identify where immediate action is needed.
The real purpose of a dashboard isn’t just to present numbers; it’s to turn data into decisions. A well-designed dashboard helps users answer three critical questions:
- What’s happening? – Shows real-time or periodic performance metrics that highlight progress and challenges.
- Why does it matter? – Provides context, helping users interpret trends, compare results, and understand their impact.
- What should I do next? – Suggests actions or areas that need attention, guiding smarter and faster decision-making.
By simplifying complex data and making insights accessible at a glance, dashboards empower professionals—from analysts to executives—to respond proactively and strategically. In this way, they move beyond static reports to become dynamic tools for continuous business improvement.
Types of Dashboards
Different types of dashboards serve different audiences and purposes within an organization. Here are the three main categories:
| Type | Purpose | Examples |
| Operational Dashboards | Focus on day-to-day performance, providing real-time updates that help teams act quickly. These dashboards are ideal for monitoring ongoing processes and resolving issues as they arise. | Tracking supply chain delays, website uptime, or customer service ticket volumes |
| Strategic Dashboards | Offer executives and senior managers a high-level view of long-term business performance. They summarize key KPIs, helping leaders evaluate progress toward strategic goals and make informed, data-driven decisions. | Monitoring revenue growth, churn rate, market share, or profitability |
| Analytical Dashboards | Allow users to dig deeper into data, identify patterns, and uncover root causes behind performance trends. These dashboards are used for exploration, planning, and optimization. | Analyzing regional sales drops, customer churn drivers, or segment profitability |
The Strategic Value of Business Dashboards
In a data-driven world, speed and clarity are everything. Business analytics dashboards bridge the gap between raw data and strategic action. They enable organizations to:
- Enhance transparency: Everyone from frontline employees to executives sees the same, up-to-date information.
- Improve accountability: Clear metrics make it easier to track progress and ownership across teams.
- Support proactive decisions: Real-time data helps organizations identify opportunities or issues before they escalate.
- Save time: Automated data visualization reduces manual reporting and lets teams focus on insight rather than collection.
Ultimately, dashboards don’t just report what has happened—they illuminate what’s possible next.
8 Steps to Create an Actionable Business Analytics Dashboard
Building an effective dashboard starts with clarity of purpose—each step should move from raw data toward actionable insight.
1. Start With the Decision, Not the Data
Dashboards are most powerful when they support real decisions rather than display every metric available. Before designing, sit with users to understand what keeps them up at night. A marketing manager doesn’t need every clickstream detail—she needs to know which campaign is slipping so she can reallocate budget. A warehouse manager doesn’t want averages; he wants early warnings about likely stockouts. Tools like Miro can help map decision journeys and uncover which insights actually drive action.
2. Blend Real-Time with Predictive Views
In 2025, static end-of-month reports aren’t enough. Business operates in real time, so dashboards should surface issues like service dips or sudden demand spikes the moment they occur. But forward-looking insight is just as critical. By incorporating predictive analytics—such as churn forecasts or demand projections—dashboards evolve from being rear-view mirrors to windshields. Platforms like Google BigQuery ML allow teams to embed predictive models directly into dashboards for a proactive view.
3. Design for Simplicity and Elegance
Complex data demands simple design. The most effective dashboards use clean charts, restrained colors, and highlight only three to five core KPIs while offering drill-downs for detail. A cluttered dashboard feels like a messy desk—nobody wants to stay there. If you want to dive deeper into dashboard design principles, courses like Data Visualization with Tableau (Coursera) cover practical ways to create user-friendly layouts.”.
4. Make It Interactive and Conversational
Dashboards shouldn’t be static posters; they should encourage exploration. Users should be able to filter by region, drill into product performance, or click for context. Modern platforms are pushing this further with conversational analytics. For instance, Tableau’s Ask Data lets users type plain-language questions like “Show sales in Europe last quarter” and get immediate answers. This makes analytics accessible not just to data specialists but to everyone across the organization.
5. Build on Trustworthy Data
No matter how elegant the design, dashboards collapse without trusted data. Metrics must be consistently defined, sources transparent, and updates reliable. When two teams look at the same metric, they should see the same number. Role-based access also builds confidence by ensuring the right people see the right information. For teams looking to build skills in data governance and quality, online courses such as Data Management Fundamentals (DAMA) can provide structured learning.
6. Highlight the “So What?”
Numbers on their own don’t drive change—it’s the meaning behind them that matters. If churn rises by 5%, what action should be taken? If sales exceed forecast, what’s the next move? Dashboards that drive action often include short, plain-language recommendations next to metrics. Features like Power BI’s Smart Narratives automatically generate explanations, helping users bridge the gap between data and decisions without needing to hunt for insights.
7. Weave Dashboards Into Everyday Tools
The best dashboards are those that people barely notice as separate tools because they’re embedded into the platforms they already use. Whether inside a CRM, a project management app, or a mobile device, dashboards should feel like a natural part of daily workflows. For example, Salesforce Embedded Analytics allows teams to access dashboards directly in their CRM environment, ensuring insights appear right where decisions are made.
8. Treat Dashboards as Living Products
A dashboard isn’t finished once it launches. Business priorities shift, users discover gaps, and design patterns evolve. Treat dashboards like living products—monitor usage, gather feedback, and refine regularly. This continuous improvement keeps them aligned with changing needs. Tools like Hotjar can track user interactions and provide direct feedback, helping teams understand which features are used, which are ignored, and what needs to be improved.
Why Dashboards Often Fail (and How to Avoid It)
Even with the right process, many business analytics dashboards still miss the mark. They try to show everything at once, creating cluttered screens where insights hide behind noise. Users glance once, feel lost, and rarely return.
Dashboards that truly drive action take a different approach: they highlight what’s unusual, emphasize priorities, and tell a clear story quickly—because no manager has time to decode 15 charts before their first coffee.
Most failures come down to a few common pitfalls:
- Too many metrics: Overload hides priorities. Keep 3–5 core KPIs, with drill-downs for detail.
- Unclear ownership: Without someone maintaining it, data becomes stale and untrusted. Assign responsibility.
- Design over clarity: Flashy visuals confuse more than they help. Favor clean, simple layouts that make insights obvious.
Keeping these traps in mind ensures your dashboard stays usable, trusted, and—most importantly—actionable.
Measuring Business Analytics Dashboard Success
A dashboard isn’t helpful just because it looks polished—it’s valuable only when people use it and make smarter decisions. To gauge whether your dashboard is delivering, focus on three key areas:
- Usage: Track metrics like logins, session time, and repeat visits—Google Analytics (GA4) can even surface how often dashboards are accessed across web and mobile.
- Decision Impact: Observe whether stakeholders are acting differently—are teams making quicker or more strategic choices thanks to insights surfaced?
- User Feedback: Run quarterly surveys or informal check-ins to find out if the dashboard is helping or confusing.
When usage drops, choices remain unchanged, or feedback turns negative, it’s time to iterate—because a dashboard that isn’t used simply isn’t delivering value.
Final Thoughts
A business analytics dashboard should feel like a compass, not a maze. When built with clarity, trust, and empathy for the user, it does more than display data—it guides decisions.
Think of it as the colleague who never tires of crunching numbers, who always has the latest updates, and who gently nudges you toward the next right move. That’s the true goal of analytics in 2025: not just more data, but better action. And if you’re ever unsure or need a hand, our AI assistant is here to guide you.


