In 2026, launching a career in business analytics can be a game-changing move for professionals looking to combine their analytical skills with strategic business thinking. Organizations across industries are increasingly relying on data to make smarter decisions, creating an unprecedented demand for skilled analysts. If you’re considering this path, equipping yourself with the right tools is essential—not just to get started, but to excel and grow in business analytics careers.
Whether you’re fresh out of college or looking to upskill, understanding the core tools will help you analyze data effectively, communicate insights, and make data-driven recommendations. In this guide, we’ll explore the must-have tools, explain why they matter, and provide practical tips for mastering them.
Understanding the Role of a Business Analyst
A business analyst turns raw data into actionable insights that drive smarter business decisions. They play a key role in helping organizations understand trends, optimize operations, and plan strategically. Analysts don’t just work with numbers—they communicate findings, forecast trends, and collaborate with teams to ensure decisions are data-driven.
Key responsibilities include:
- Data Collection: Gather information from sources like sales reports, customer feedback, and market research.
- Data Analysis: Clean, organize, and analyze data using tools such as Excel, SQL, and Tableau.
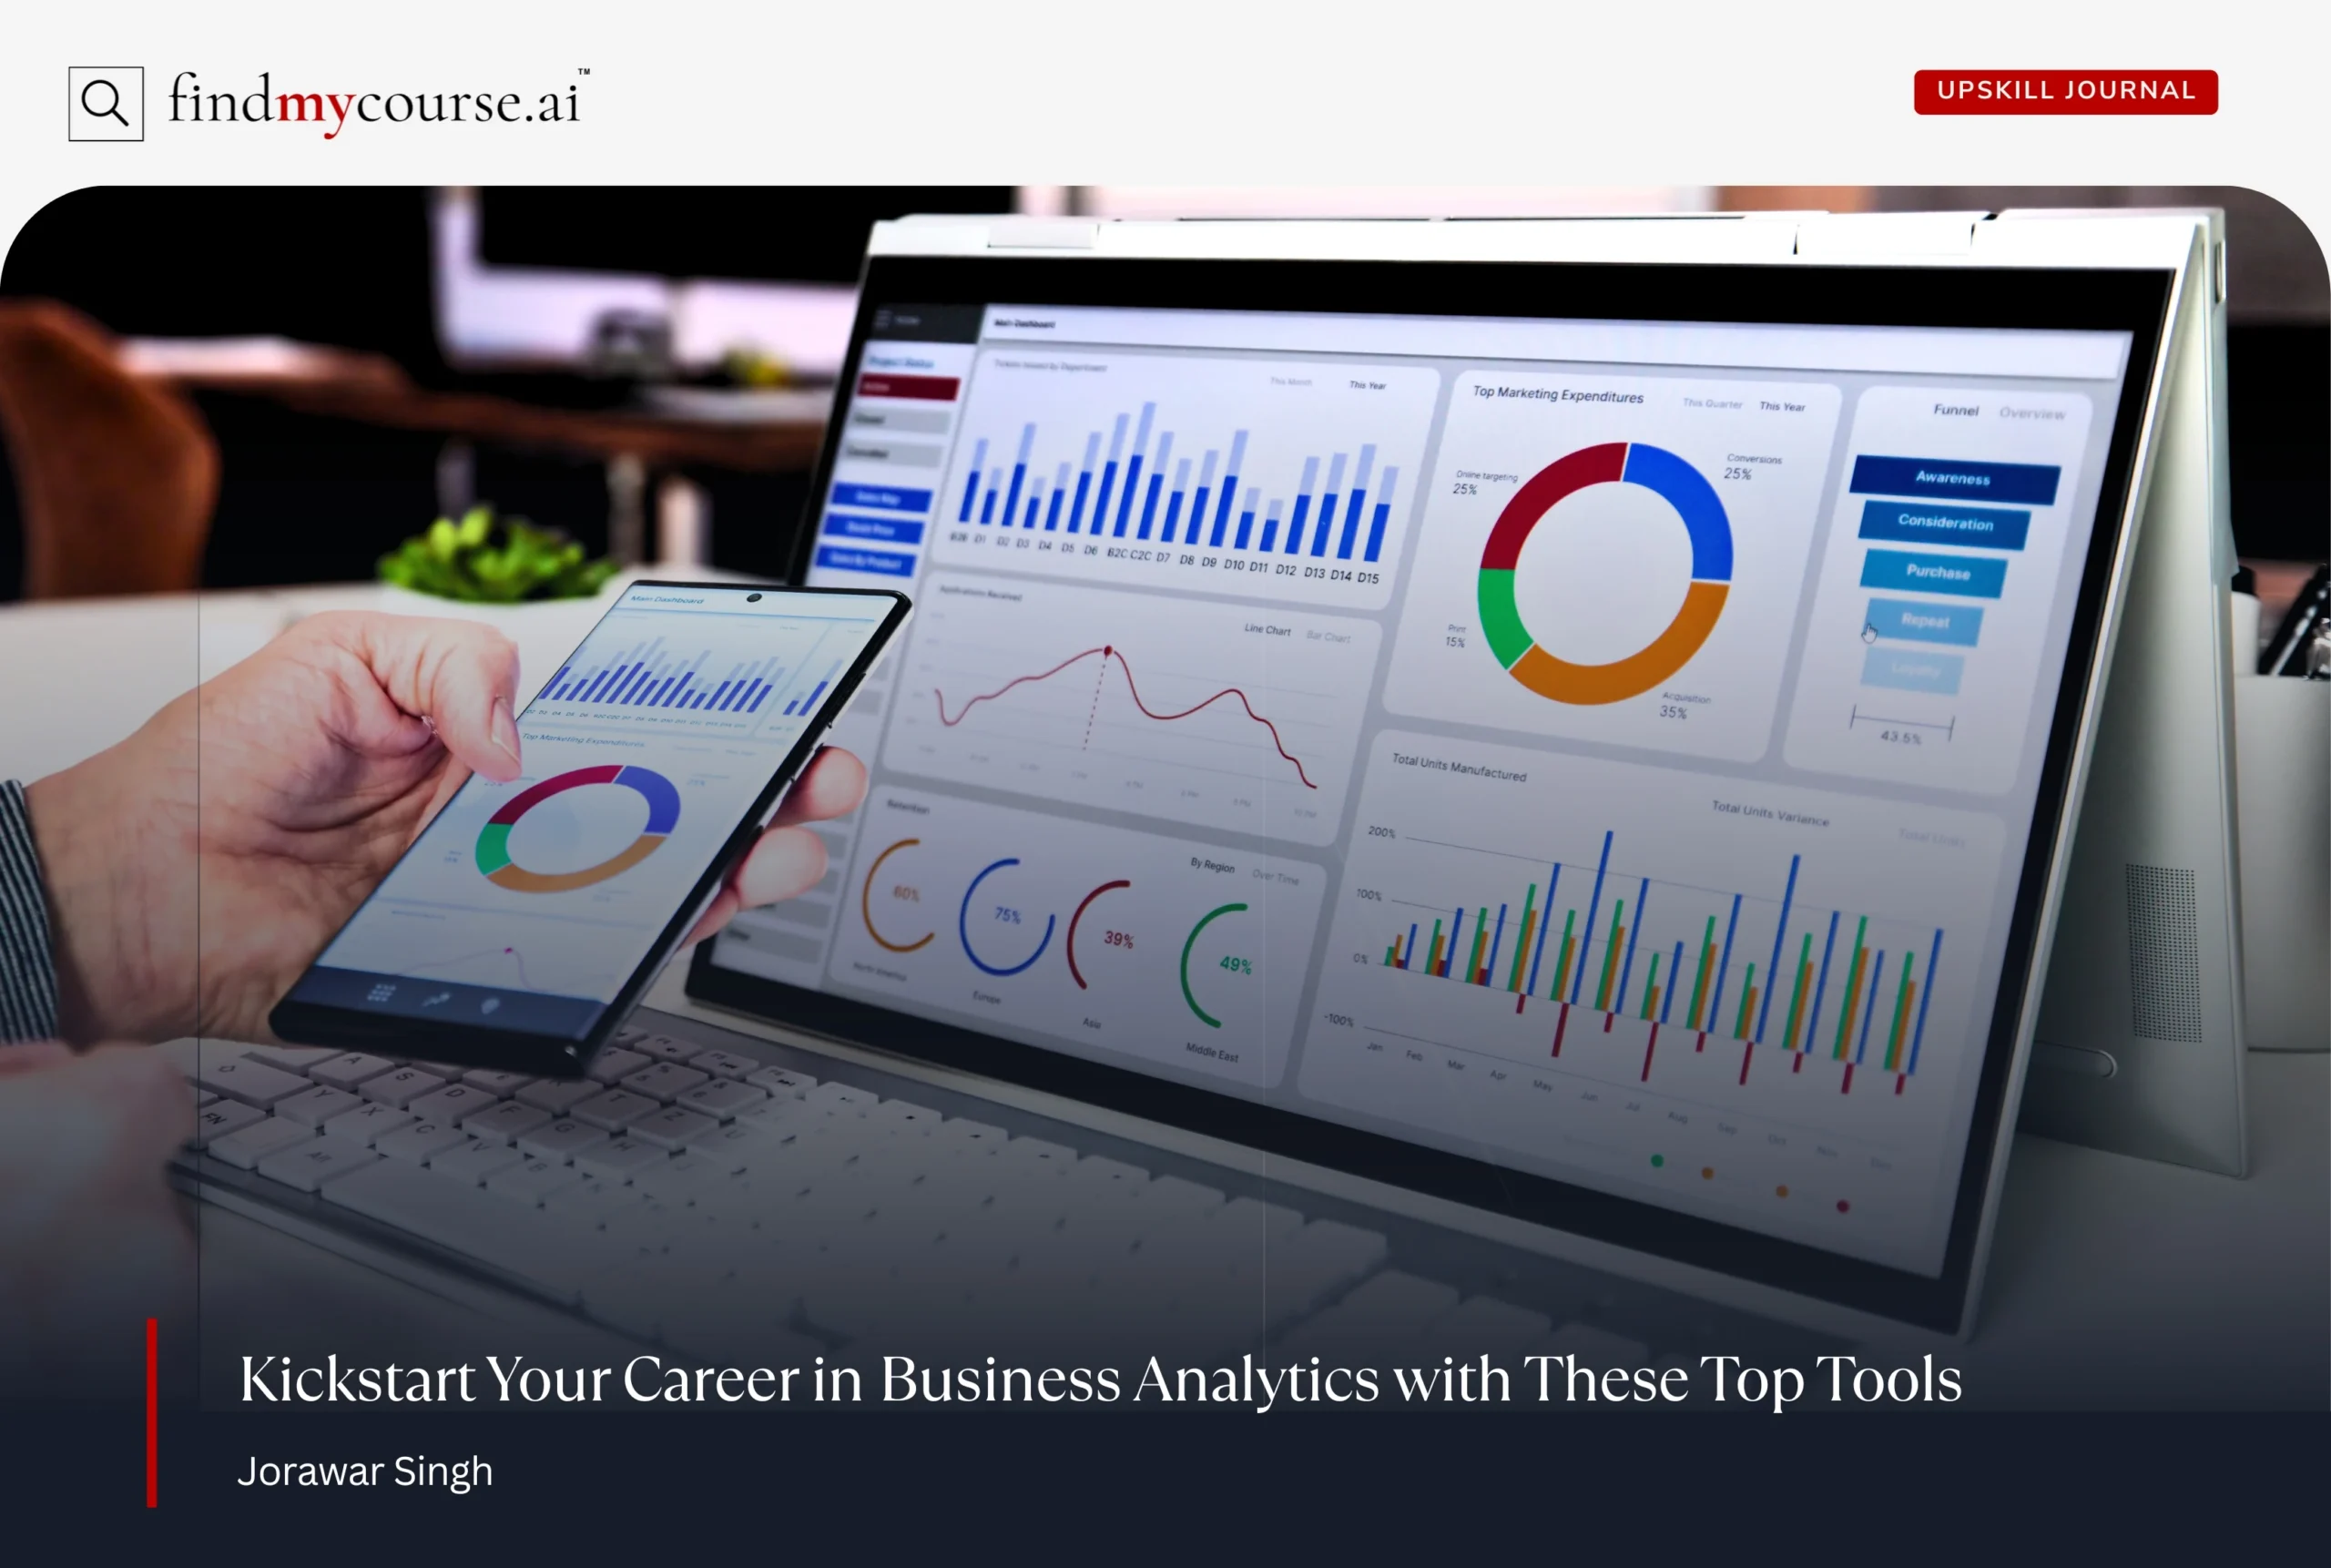
- Visualization & Reporting: Present insights through dashboards, charts, and reports that are easy to understand.
- Collaboration: Work with marketing, finance, and operations teams to align insights with business objectives.
- Strategic Recommendations: Identify trends, opportunities, and potential impacts of business decisions.
By combining technical skills with critical thinking, business analysts bridge the gap between data and strategy, enabling organizations to act confidently on insights and achieve meaningful outcomes.
Why Tools Matter in Business Analytics Careers
A career in business analytics is more than analysing numbers; it’s about uncovering insights that shape smarter business strategies.The right tools allow you to:
- Efficiently collect and organize data
- Perform in-depth analyses
- Visualize patterns and trends
- Share actionable insights with stakeholders
Moreover, being proficient in these tools signals to employers that you are ready to hit the ground running. In today’s competitive market, technical proficiency combined with analytical thinking can set you apart from other candidates.
Core Tools to Start Your Career in Business Analytics
To succeed in business analytics careers, you need a combination of data manipulation, statistical analysis, visualization, and reporting tools. Let’s break them down:
1. Microsoft Excel
Excel remains a cornerstone of business analytics. Its flexibility allows beginners to manipulate data, create pivot tables, perform basic statistical analyses, and generate charts. Moreover, Excel is often the first tool companies expect analysts to know, making it an essential skill for any career in business analytics. For more advanced work, Excel integrates with Power Query and VBA, offering automation and more sophisticated data handling.
2. SQL (Structured Query Language)
SQL is the standard language for querying databases. Most business data resides in relational databases, and knowing how to extract, filter, and summarize this information is crucial. SQL empowers analysts to answer complex business questions quickly and efficiently. Learning SQL is especially valuable for those interested in data-intensive industries like finance, marketing, and healthcare.
3. Tableau
Tableau is a leading data visualization tool that enables analysts to create interactive, shareable dashboards. Unlike spreadsheets, Tableau allows you to visualize complex data intuitively. As a result, stakeholders can understand insights at a glance, facilitating better decision-making. Learning Tableau also demonstrates your ability to communicate data-driven findings effectively—a key requirement in business analytics careers.
4. Power BI
Power BI is another powerful visualization tool, particularly popular in organizations using the Microsoft ecosystem. It allows seamless integration with Excel, Azure, and other business applications. Analysts can build real-time dashboards, automate reports, and perform complex data modeling. In addition, Power BI’s strong community support ensures ample learning resources for beginners.
5. Python
Python has emerged as a go-to language for business analysts due to its simplicity and versatility. Libraries like Pandas, NumPy, and Matplotlib enable data cleaning, statistical analysis, and visualization. Furthermore, Python supports automation, predictive modeling, and even machine learning for more advanced analytics. For professionals aiming to advance in business analytics careers, Python is an invaluable tool.
6. R
R is a specialized language for statistical computing and is particularly useful for deep data analysis and academic research. While Python is often preferred for its versatility, R shines in performing complex statistical tests and visualizations. Knowledge of R adds depth to your skill set and signals strong analytical capabilities to employers.
7. Google Analytics
For business analysts interested in digital marketing, Google Analytics provides actionable insights into website traffic, user behavior, and campaign performance. Understanding these metrics helps businesses optimize their online presence. Moreover, proficiency in Google Analytics is increasingly sought after in marketing analytics roles within business analytics careers.
8. Jupyter Notebooks
Jupyter Notebooks offer an interactive computing environment where analysts can combine live code, documentation, and visualizations. This is especially useful for exploratory data analysis and sharing insights in a collaborative manner. Python users often rely on Jupyter to test hypotheses and communicate findings effectively.
9. Looker
Looker is a modern business intelligence platform that helps analysts explore and analyze real-time data. With strong cloud integration and visualization features, it enables teams to make data-driven decisions at scale. Knowledge of Looker is a significant advantage for professionals aiming for roles in large enterprises or tech-forward companies.
10. Qlik Sense
Qlik Sense is a self-service data analytics tool that allows users to create personalized dashboards and reports. Its associative model makes it easy to explore relationships in complex datasets. Additionally, it fosters a data-driven culture in organizations by enabling both technical and non-technical users to access insights independently.
Building Practical Experience and Mastering Essential Tools
Understanding tools theoretically is important, but practical experience solidifies your capabilities. A career in business analytics requires both technical proficiency and real-world application.
Start by learning the essential tools online. Platforms like Coursera, edX, and Udemy offer structured courses to help you gain proficiency:
- Coursera – Excel Skills for Business Specialization: Master formulas, pivot tables, and data visualization.
- edX – Analyzing and Visualizing Data with Power BI: Learn dashboards, reporting, and data modeling.
- Udemy – The Complete SQL Bootcamp: Gain hands-on experience querying and managing databases.
Once you have the basics, apply your skills through actionable experience:
- Internships: Work on real datasets and contribute to business decisions.
- Projects: Build dashboards or analyze public datasets to showcase your skills.
- Networking: Join online communities, attend webinars, or participate in data challenges.
- Certifications: Earn credentials in Tableau, Power BI, or Python to validate your expertise.
By combining online learning with practical projects, you strengthen your technical foundation while demonstrating readiness for a successful career in business analytics.
Final Thoughts
Starting a career in business analytics in 2026 is more achievable than ever with abundant resources and tools. By mastering Excel, SQL, Tableau, and Python, and combining them with hands-on experience, you position yourself for success. Business analytics careers go beyond numbers—they’re about driving meaningful growth through actionable insights. Embrace continuous learning, stay curious, and apply your skills strategically. With dedication and practice, you can thrive in this dynamic field. And if you need guidance or have questions about these tools, our AI assistant is ready to provide personalized support on your learning journey.


